Price Tag Daily

Prices have outpaced paychecks 6 months in a row
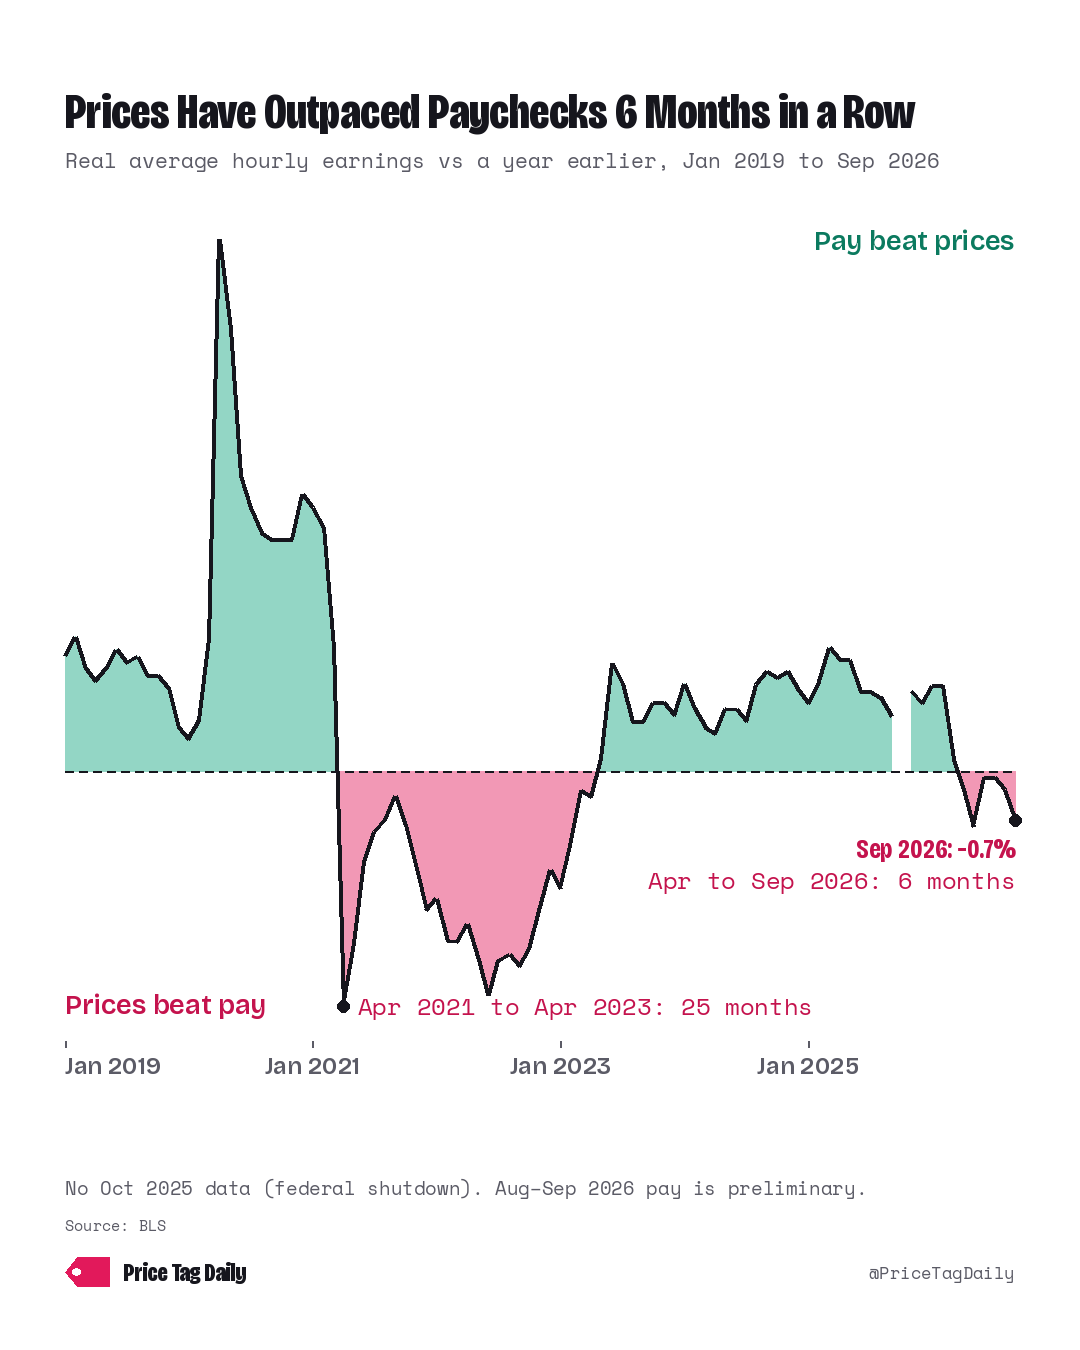
Line chart, real average hourly earnings, all employees, total private (inflation-adjusted, BLS), change from a year earlier, monthly, Jan 2019 to Sep 2026. Area above zero in green (pay beat prices), below zero in pink (prices beat pay). Below zero in two stretches: Apr 2021 to Apr 2023 (25 months) and Apr to Sep 2026 (6 months, the latest). Low point Apr 2021: −3.4%. Latest Sep 2026: −0.7%. Sep 2026 vs a year earlier: average hourly pay +3.0%, consumer prices +3.7%. High point Apr 2020: +7.7%. The April 2020 jump came mostly from job losses among lower-paid workers, which raised the average (BLS). No Oct 2025 data (federal shutdown), shown as a gap in the line. Aug–Sep 2026 pay is preliminary. Series: CES0500000013 (real average hourly earnings, seasonally adjusted), CES0500000003 (average hourly earnings), CUUR0000SA0 (CPI-U all items, not seasonally adjusted).

Prices have risen faster than paychecks for 6 months in a row, Apr to Sep 2026. The stretch before ran 25 months, Apr 2021 to Apr 2023. Sep 2026 vs a year earlier: average hourly pay +3.0%, consumer prices +3.7%. The April 2020 jump came mostly from job losses among lower-paid workers, which raised the average (BLS).

Source: BLS Current Employment Statistics and Consumer Price Index via the BLS Public Data API: real average hourly earnings, all employees, total private, 1982-84 dollars, seasonally adjusted (CES0500000013); average hourly earnings, all employees, total private, seasonally adjusted (CES0500000003); CPI-U all items, U.S. city average, not seasonally adjusted (CUUR0000SA0) · retrieved Oct 27, 2026

Spot an error? Email [email protected]. We log every fix on the corrections page.

All charts · Get them by email