Price Tag Daily

Grocery prices are up 33.2% since 2019
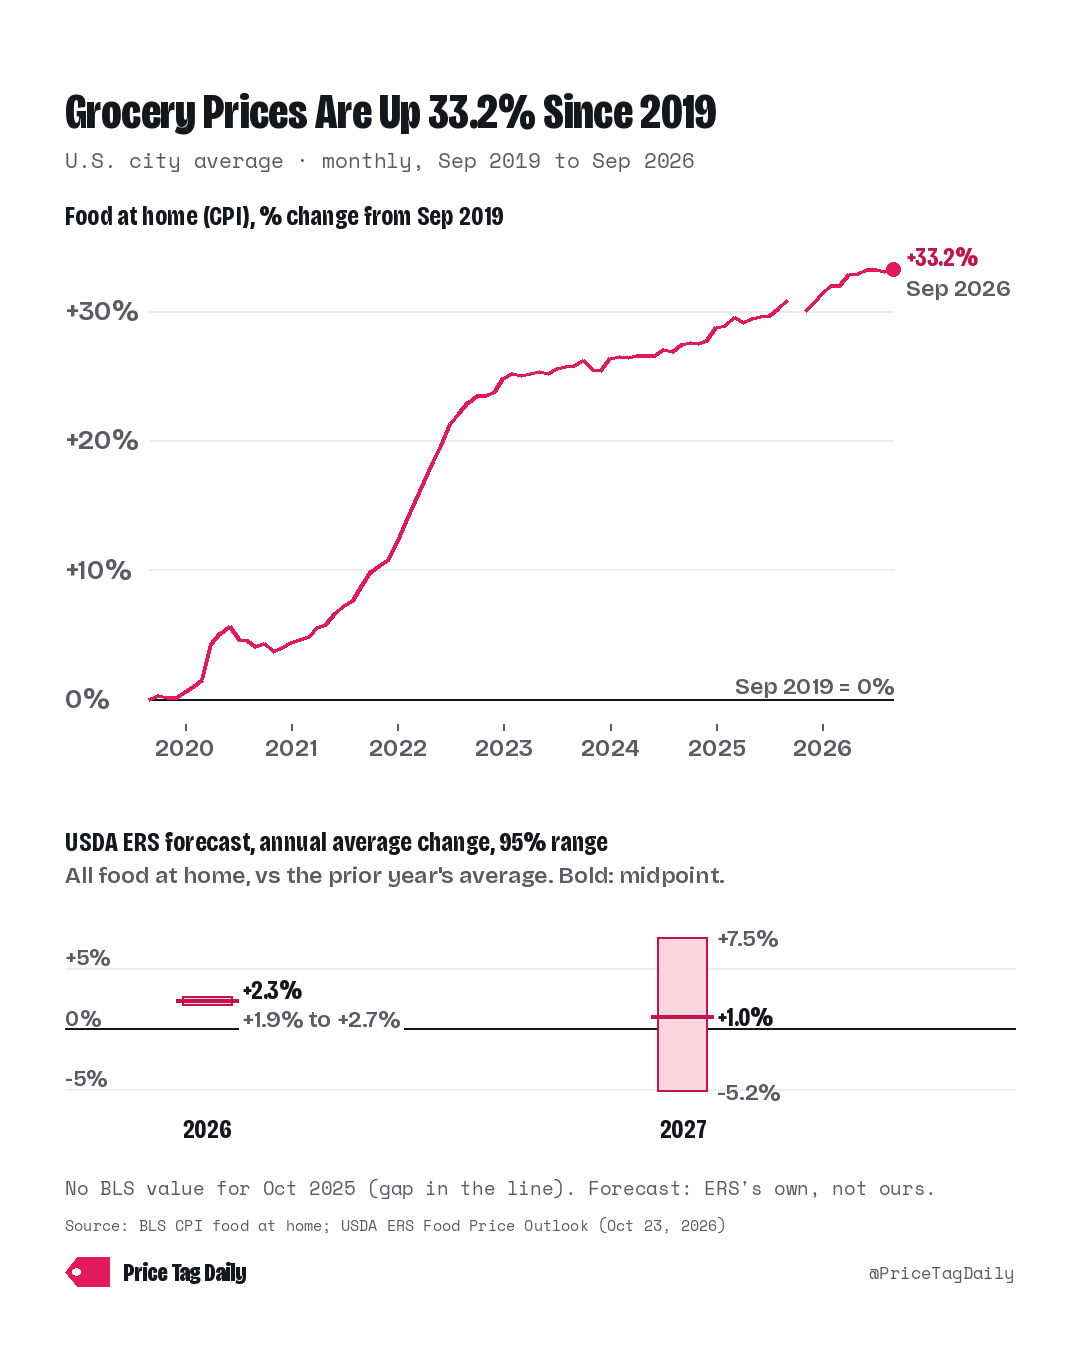
Line chart, food at home (CPI), U.S. city average, % change from Sep 2019, monthly, Sep 2019 → Sep 2026: +33.2% in Sep 2026; no BLS value for Oct 2025 (gap in the line). Panel, USDA ERS forecast, annual average change vs the prior year's average, 95% range, bold midpoint: 2026 +2.3% (+1.9% to +2.7%); 2027 +1.0% (-5.2% to +7.5%). Forecast: ERS's own, not ours. Source: BLS CPI-U food at home, CUUR0000SAF11 (not seasonally adjusted); USDA ERS Food Price Outlook, Oct 23, 2026 release.

Food at home (CPI): +33.2%, Sep 2019 → Sep 2026. USDA ERS forecast: 2026 +2.3% (+1.9% to +2.7%), 2027 +1.0% (-5.2% to +7.5%).

Source: BLS CPI-U food at home, U.S. city average, not seasonally adjusted (CUUR0000SAF11); USDA ERS Food Price Outlook, all food at home, 10/23/2026 release, ers.usda.gov/data-products/food-price-outlook · retrieved Oct 27, 2026

Spot an error? Email [email protected]. We log every fix on the corrections page.

All charts · Get them by email