
Family health plans cost 30% of median income
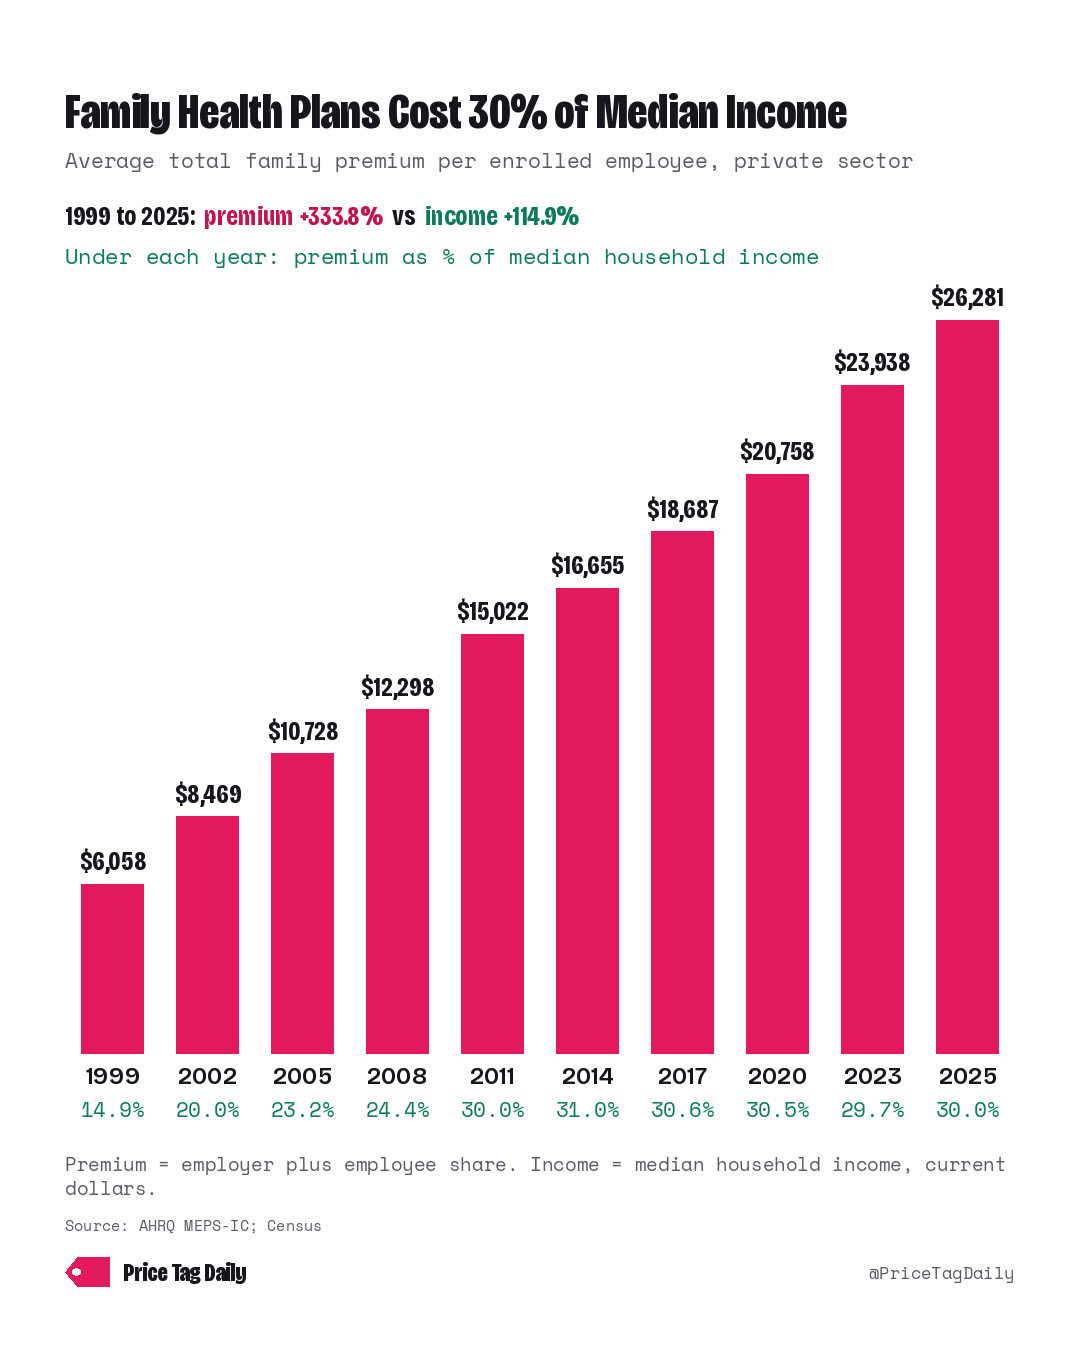
1999 to 2025: premium +333.8% vs median household income +114.9%. The 2025 family premium, $26,281, is 30.0% of median household income. Where Census Table H-5 lists a year twice (method changes), we use its newer-method row.
Source: AHRQ Medical Expenditure Panel Survey, Insurance Component (MEPS-IC), private sector, national, table I.D.1: average total family premium per enrolled employee at private-sector establishments that offer health insurance, United States, all firm sizes; 2025 estimates released July 2026, AHRQ Data Tools export (datatools.ahrq.gov/meps-ic). Census Current Population Survey, 2026 Annual Social and Economic Supplement, Table H-5, median household income, All Races, current dollars (www2.census.gov/programs-surveys/cps/tables/time-series/historical-income-households/h05.xlsx) · retrieved Oct 27, 2026
Spot an error? Email [email protected]. We log every fix on the corrections page.